LinkedIn CC - Choose the right visualization framework
How can you scale data visualizations for large datasets?
Choose the right visualization framework
Data visualizations can be powerful to generate insights or improve understanding of something that you care about.
Data visualization can also get in the way if they are really slow to load the required viz, or dont react to your inputs.
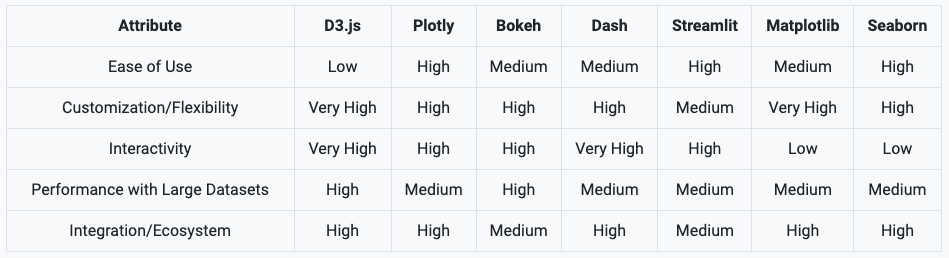
When considering the many options for data visualization frameworks, it’s akin to navigating the bustling streets of a metropolis, each sign pointing in a different direction - D3.js, Plotly, Bokeh, Dash, Streamlit, Matplotlib, Seaborn. The choice, while abundant, boils down to what fits your journey best.
This would be my way of evaluating the different frameworks to use for my data visualization.
Boil down the problem and resources at hand on these attributes (Learning curve, Flexibility in the future, Level of Self-serve, Size of datasets, Integrations)
Before implementing the data presentation layer, ensure your data platform is has robust foundations in - your data model. Validate your requirements for - the reporting layer datasets - with granularity, catering to your user's needs. Lastly, make sure to filter the data before feeding into your rendering engine.